# Export phase energies as a table
This snippet can be used to export the results of a calculation to a Pandas DataFrame object.
[1]:
from pycalphad import Workspace, variables as v
from pycalphad.property_framework.metaproperties import IsolatedPhase
import pandas as pd

wks = Workspace('alzn_mey.tdb', ['AL', 'ZN'],
                ['FCC_A1', 'HCP_A3', 'LIQUID'],
                {v.X('ZN'):(0,1,0.02), v.T: (300, 1000, 10), v.P:101325, v.N: 1})

props = [v.T, v.X('AL'), v.X('ZN')]
for phase_name in wks.phases:
    prop = IsolatedPhase(phase_name, wks)(f'GM({phase_name})')
    prop.display_name = f'GM({phase_name})'
    props.append(prop)

data = {f'{key.display_name} [{key.display_units}]': value.reshape(-1)
        for key, value in wks.get_dict(*props).items()}

pd.DataFrame(data)
[1]:
| Temperature [kelvin] | X_AL [fraction] | X_ZN [fraction] | GM(FCC_A1) [J / mol] | GM(HCP_A3) [J / mol] | GM(LIQUID) [J / mol] | |
|---|---|---|---|---|---|---|
| 0 | 300.0 | 1.00 | 1.000000e-10 | -8496.605675 | -3555.605675 | -1043.275310 |
| 1 | 300.0 | 0.98 | 2.000000e-02 | -8564.717990 | -3674.761325 | -1250.180921 |
| 2 | 300.0 | 0.96 | 4.000000e-02 | -8573.037243 | -3733.289523 | -1394.468476 |
| 3 | 300.0 | 0.94 | 6.000000e-02 | -8564.854312 | -3774.752790 | -1519.171542 |
| 4 | 300.0 | 0.92 | 8.000000e-02 | -8549.523829 | -3808.760080 | -1633.419774 |
| ... | ... | ... | ... | ... | ... | ... |
| 3495 | 990.0 | 0.10 | 9.000000e-01 | -54233.504407 | -54769.630291 | -58354.955825 |
| 3496 | 990.0 | 0.08 | 9.200000e-01 | -54199.685094 | -54895.795230 | -58409.376195 |
| 3497 | 990.0 | 0.06 | 9.400000e-01 | -54123.191596 | -54986.670187 | -58424.306318 |
| 3498 | 990.0 | 0.04 | 9.600000e-01 | -53989.616338 | -55028.419738 | -58385.478971 |
| 3499 | 990.0 | 0.02 | 9.800000e-01 | -53768.693811 | -54991.395316 | -58262.766288 |
3500 rows × 6 columns
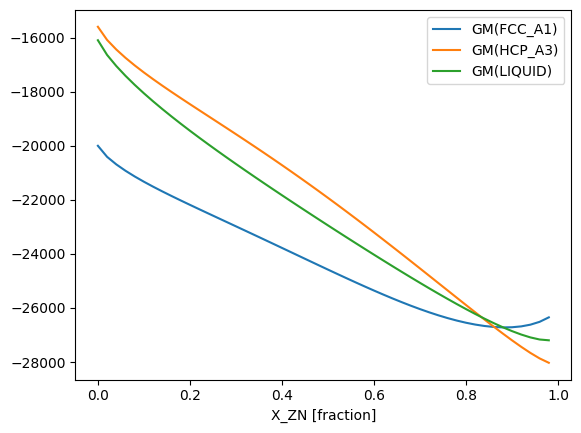
Plot energy curves for several phases
[2]:
from pycalphad import Workspace, variables as v
from pycalphad.property_framework.metaproperties import IsolatedPhase
import matplotlib.pyplot as plt

wks2 = Workspace('alzn_mey.tdb', ['AL', 'ZN'],
                ['FCC_A1', 'HCP_A3', 'LIQUID'],
                {v.X('ZN'):(0,1,0.02), v.T: 600, v.P:101325, v.N: 1})

fig = plt.figure()
ax = fig.add_subplot()

x = wks2.get(v.X('ZN'))
ax.set_xlabel(f"{v.X('ZN').display_name} [{v.X('ZN').display_units}]")

for phase_name in wks2.phases:
    # Workaround for poor starting point selection in IsolatedPhase
    metastable_wks = wks2.copy()
    metastable_wks.phases = [phase_name]
    prop = IsolatedPhase(phase_name, metastable_wks)(f'GM({phase_name})')
    prop.display_name = f'GM({phase_name})'
    ax.plot(x, wks2.get(prop), label=prop.display_name)
ax.legend()
[2]:
<matplotlib.legend.Legend at 0x7f0d36725d80>

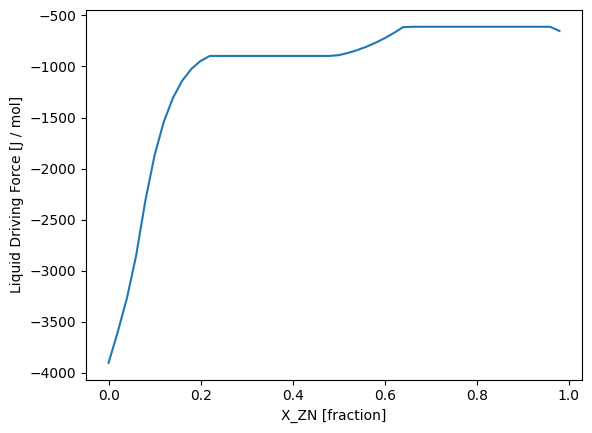
Driving force calculation
[3]:
from pycalphad import Workspace, variables as v
from pycalphad.property_framework.metaproperties import DormantPhase

wks3 = Workspace('alzn_mey.tdb', ['AL', 'ZN'],
                ['FCC_A1', 'HCP_A3', 'LIQUID'],
                {v.X('ZN'):(0,1,0.02), v.T: 600, v.P:101325, v.N: 1})
metastable_liq_wks = wks3.copy()
metastable_liq_wks.phases = ['LIQUID']
liq_driving_force = DormantPhase('LIQUID', metastable_liq_wks).driving_force
liq_driving_force.display_name = 'Liquid Driving Force'

fig = plt.figure()
ax = fig.add_subplot()
ax.plot(wks3.get(v.X('ZN')), wks3.get(liq_driving_force))
ax.set_xlabel(f"{v.X('ZN').display_name} [{v.X('ZN').display_units}]")
ax.set_ylabel(f"{liq_driving_force.display_name} [{liq_driving_force.display_units}]")
[3]:
Text(0, 0.5, 'Liquid Driving Force [J / mol]')

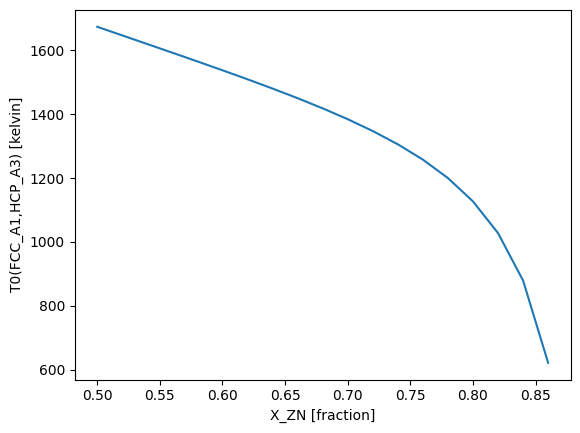
Calculate T0 (t-zero) as a function of composition
The T0 (t-zero) temperature is a thermodynamic condition in which two specified phases have the same value of the Gibbs energy. Below T0, a so-called “massive” phase transition is thermodynamically favored to occur, without a barrier to diffusion.
[4]:
from pycalphad.property_framework.tzero import T0

# For T0, conditions must be one-dimensional (step calculation)
wks4 = Workspace('alzn_mey.tdb', ['AL', 'ZN'],
                ['FCC_A1', 'HCP_A3', 'LIQUID'],
                {v.X('ZN'): (0,1,0.02), v.T: 300, v.P:101325, v.N: 1})
tzero = T0('FCC_A1', 'HCP_A3', wks4)
tzero.maximum_value = 1700 # set temperature limit

fig = plt.figure()
ax = fig.add_subplot()
ax.plot(wks4.get(v.X('ZN')), wks4.get(tzero))
ax.set_xlabel(f"{v.X('ZN').display_name} [{v.X('ZN').display_units}]")
ax.set_ylabel(f"{tzero} [{tzero.display_units}]")
[4]:
Text(0, 0.5, 'T0(FCC_A1,HCP_A3) [kelvin]')

[ ]: