FAQ
What units does PyCalphad use?
PyCalphad uses pint for user-facing unit support.
With pint, PyCalphad’s computable property framework supports display_units that can be overridden and converted with pint.
There are also implementation_units that cannot be overriden and are as follows:
All implementation units are SI units.
Molar quantities are used for state variables, e.g. energy has units
J/mol.Composition and site occupancies are mole fractions.
Is any parallelism supported in PyCalphad?
PyCalphad does not support parallelization out of the box since version 0.8, however it is possible to use PyCalphad in parallel via multi-processing packages such as dask.
How long should equilibrium calculations take?
Whenever you create a new Workspace object and do your first calculation with a database, set of components, and phases, there’s some overhead as the code constructions Model objects and compiles Gibbs energy functions and their necessary derivatives (via SymEngine’s lambidfy) to fast machine code that is used throughout PyCalphad’s energy minimizer.
Once you pay that one-time overhead and warm the cache with objects, subsequent equilibria are faster to compute.
Performance and scaling depends highly on the system of study, including:
Number of components (system size)
Number of phases being considered
Complexity of the phase models (number of internal degrees of freedom)
Number of iterations required for the minimizer to find a solution for the given conditions
A simple scaling benchmark based on the COST-507 database is included below.
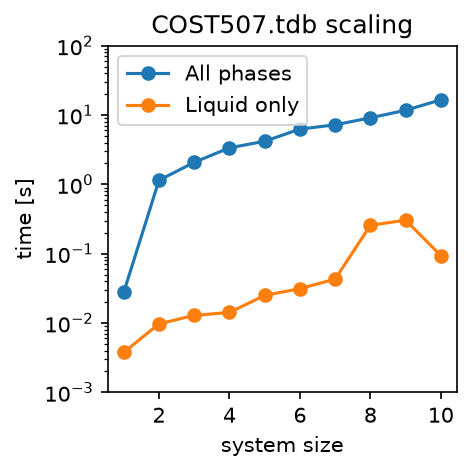
The benchmark demonstrates scaling in number of components in a scenario where only one phase is included and one where all the possible phases are included. The scaling laws in both cases are proportional, but there’s a clear jump in complexity when more phases (and more complicated phases) are included.
If computation time is critical, it is beneficial to remove phases that will be metastable.
Click to see example scaling benchmark code
 1from time import perf_counter
 2from importlib.resources import files
 3import pandas as pd
 4import matplotlib.pyplot as plt
 5from pycalphad import Database, Workspace, variables as v
 6from pycalphad.core.utils import filter_phases
 7import pycalphad.tests.databases
 8
 9databases = files(pycalphad.tests.databases)
10
11REPEATS = 20
12database_filename = "COST507.tdb"
13title = f"{database_filename} scaling"
14filename_prefix = title.replace(" ", "_")
15# sorted by frequency of occurance in ternary assessments
16all_elements = ['AL', 'TI', 'MG', 'CU', 'SI', 'ZN', 'MN', 'SN', 'FE', 'CR']
17
18db = Database(databases / database_filename)
19
20data_single_phase = []
21global_phases = ["LIQUID"]
22for system_size in range(1, len(all_elements)+1):
23    components = all_elements[:system_size] + ["VA"]
24    composition_conditions = {v.X(el): 1/system_size for el in components[1:system_size]}
25    # intermediate temperature to encourage single phase with no miscibility gaps
26    conditions = {v.P: 101325, v.T: 1200.0, v.N: 1, **composition_conditions}
27    phases = filter_phases(db, components, global_phases)
28    print(system_size, components, composition_conditions)
29    for _ in range(REPEATS):
30        wks = Workspace(db, components, phases, conditions)
31        tstart = perf_counter()
32        wks.get("GM")
33        tend = perf_counter()
34        data_single_phase.append({"system_size": system_size, "time[s]": tend-tstart, "num_phases": len(phases)})
35
36data_all_phases = []
37global_phases = list(db.phases.keys())
38for system_size in range(1, len(all_elements)+1):
39    components = all_elements[:system_size] + ["VA"]
40    composition_conditions = {v.X(el): 1/system_size for el in components[1:system_size]}
41    conditions = {v.P: 101325, v.T: 300.0, v.N: 1, **composition_conditions}
42    phases = filter_phases(db, components, global_phases)
43    print(system_size, components, composition_conditions)
44    for _ in range(REPEATS):
45        wks = Workspace(db, components, phases, conditions)
46        tstart = perf_counter()
47        wks.get("GM")
48        tend = perf_counter()
49        data_all_phases.append({"system_size": system_size, "time[s]": tend-tstart, "num_phases": len(phases)})
50
51
52df_all_phases = pd.DataFrame(data_all_phases)
53df_single_phase = pd.DataFrame(data_single_phase)
54
55df_all_phases.to_csv(filename_prefix + "-all_phases" + ".csv", index=False)
56df_single_phase.to_csv(filename_prefix + "-single_phase" + ".csv", index=False)
57
58perf_df_all_phases = df_all_phases.groupby(["system_size"]).aggregate("median")
59perf_df_single_phase = df_single_phase.groupby(["system_size"]).aggregate("median")
60
61# Plot scaling performance in number of components
62fig, ax = plt.subplots(figsize=(3,3))
63perf_df_all_phases.plot(y="time[s]", marker='o', label="All phases", ax=ax)
64perf_df_single_phase.plot(y="time[s]", marker='o', label="Liquid only", ax=ax)
65ax.set_title(title)
66ax.set_yscale("log")
67ax.set_ylabel("time [s]")
68ax.set_xlabel("system size")
69ax.set_ylim(1e-3, 1e2)
70ax.figure.savefig(filename_prefix + ".png", dpi=150, bbox_inches="tight")
Text is sometimes cut off when saving figures
Occasionally when saving images with the matplotlib function plt.savefig, axis titles and legends are cut off.
This can be fixed:
Per function call by passing
bbox_inches='tight'keyword argument toplt.savefigLocally by running
import matplotlib as mpl; mpl.rcParams['savefig.bbox'] = 'tight'Permanently by adding
savefig.bbox : tightto your matplotlibrc file.